
India's Housing Market Is Growing in Rupees, Not in Homes
RBI, ICRA and CareEdge data in 72 hours show India's housing market growing in value while area sold stalls. What the split means for banks and realty stocks.
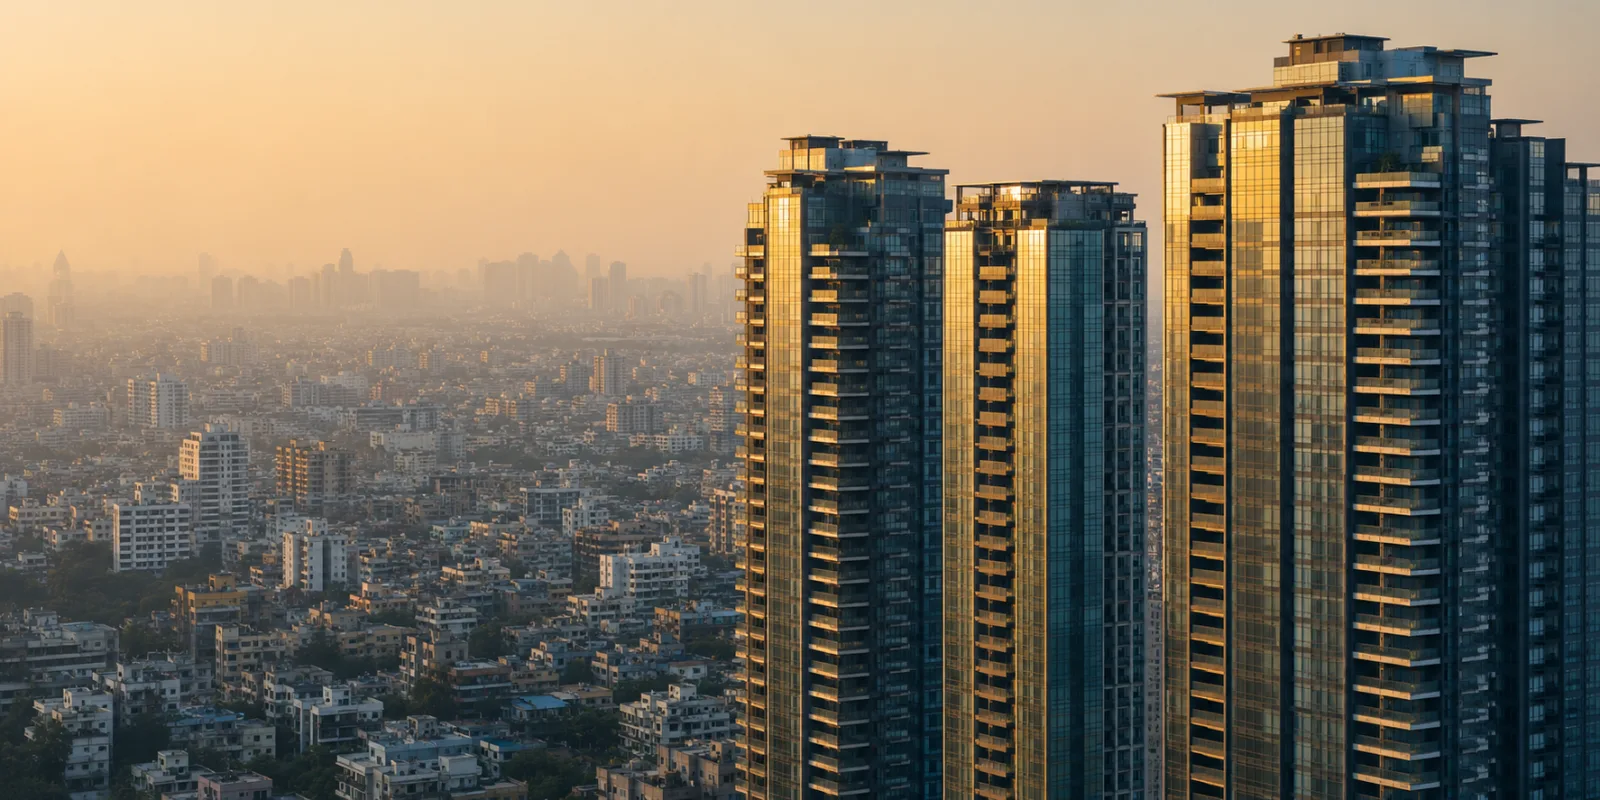
Three separate data releases landed inside a 72-hour window this week, and they all point the same way. India's residential property market is getting bigger in money terms while barely moving in square feet. That gap is not a rounding error. It is the defining feature of this cycle, and it changes what a lot of familiar numbers actually mean.
What the three releases said#
On 24 August the Reserve Bank of India published its All-India House Price Index for the June quarter. The index reached 117.5, a rise of 3.6% year on year, down from 4.5% in the preceding quarter. Sequentially prices rose 1.1%. The gains came mostly from Chandigarh, Jaipur, Kanpur, Lucknow and Thiruvananthapuram, which is to say from the smaller cities in the RBI's 18-city panel rather than the metros everyone watches.
Two days later ICRA published its FY27 residential outlook. The rating agency expects housing sales value across the top seven cities to reach about ₹7.9 trillion, up 8-11%, while area sold grows only 2-5% to roughly 665-685 million square feet. Area sold in FY26 grew 1.5% to 653 msf, on sales value of ₹7.3 trillion. Anupama Reddy, group head for corporate ratings at ICRA, expects average selling prices to rise 4-7% and launches to increase 4-7% to 760-785 msf.
The same day CareEdge Ratings published the supply-side version of the story. Homes priced below ₹1.5 crore made up 85% of new launches across the top seven cities in the first quarter of 2022. By the first quarter of 2026 that share had fallen to 47%, while the ₹1.5-4 crore band expanded from 14% to 44% and homes above ₹4 crore went from 1% to 9%. Rajashree Murkute, senior director at CareEdge, attributed the shift to rising land, construction and compliance costs that have made cheaper projects hard to build profitably, alongside steady demand from affluent domestic buyers and non-resident Indians.
Put the three together and you get a market where the rupee total keeps climbing, the physical total does not, and the composition of what gets built has changed beyond recognition in four years.
Reading a market that grows through mix#
Sales value is the product of three things: how many homes are sold, how large they are, and what each square foot costs. Growth in that headline number can come from any of the three, and the three have very different economic meaning.
Volume growth means more households are being housed. Price growth means the same households pay more for the same asset. Mix growth means the buyer at the margin is richer than last year's buyer, because the product being sold has moved up-market.
India's current cycle is running mostly on the third channel. The RBI index tells you price inflation is modest at 3.6%, well below the 6.7% real GDP growth the central bank now forecasts for FY27. ICRA tells you volume is close to flat. The residual, roughly five to six percentage points of value growth, is mix. Developers are selling bigger and more expensive homes to a narrower slice of buyers.
That distinction gets lost when the sector is described as booming. A market can post double-digit revenue growth for years while the number of families acquiring homes stays still.
What a mix-led cycle does to markets#
For listed developers, the immediate effect is lumpier earnings. Combined pre-sales for 28 listed real estate firms fell 21% to ₹39,964 crore in the June quarter from ₹50,900 crore a year earlier, even though 19 of the 28 grew. The decline was driven almost entirely by launch timing. DLF booked ₹657 crore against ₹11,425 crore in the year-ago quarter because it launched nothing at all in the period. Prestige Estates halved to ₹6,579 crore. Godrej Properties, which did launch, rose to ₹8,651 crore and took the top spot.
When a developer's quarterly revenue depends on whether a ₹5,000 crore luxury tower opened for booking in March or April, quarter-on-quarter comparisons stop carrying information. Analysts covering the Nifty Realty index increasingly have to model launch calendars rather than demand.
For banks and housing finance companies, the picture is more comfortable than the volume data suggests. Larger ticket sizes at flat volumes still grow the mortgage book, and higher-income borrowers carry lower default risk. The risk is concentration. A loan book increasingly weighted towards ₹2 crore-plus properties in a handful of metros is more exposed to a correction in those specific micro-markets than a diversified book of ₹40 lakh loans across fifty cities.
Developer balance sheets have improved substantially through this cycle. CareEdge puts the debt-to-collections ratio for the top 13 residential developers at 0.68 times in FY26, down from 1.80 times in FY20. Collections crossed ₹90,000 crore and bookings exceeded ₹1.5 lakh crore. That deleveraging is real and it matters, because it means the next downturn will not be a credit event for the large listed names in the way 2018 was.
Institutional capital has taken note. Capital inflows into Indian real estate ran at $3.5-4 billion in the first half of 2026, and the listed REIT market has widened to six trusts that distributed ₹3,136 crore to roughly 500,000 unitholders in the June quarter. Those vehicles hold offices rather than homes, so they are exposed to a different demand driver entirely: coworking operators alone leased 191,306 desks across eight cities in the first half of 2026, up 68% on the year.
The mechanics beneath the headline#
The first is the years-to-sell ratio, which divides unsold inventory by the trailing sales run rate. ICRA puts it at 1.5 years in FY26 against 1.3 in FY25, and expects 1.4-1.6 times by March 2027. Anything under about two years is generally read as balanced. The number looks healthy, but it is an average over a market whose composition is shifting, and ICRA notes that unsold inventory is increasingly concentrated in the premium and luxury bands. An aggregate ratio of 1.5 can hide a much longer overhang in one segment and a shortage in another.
The second is the difference between what ICRA and CareEdge are counting. ICRA measures sales and classifies affordable as under ₹75 lakh, or under ₹1 crore in Mumbai and the National Capital Region. On that basis affordable housing fell to 20% of sales in FY26 from 23% in FY25, with mid at 46% and luxury at 34%. CareEdge measures launches and draws its line at ₹1.5 crore. The two studies use different variables and different thresholds and still arrive at the same direction of travel, which is a stronger result than either alone.
Transaction registry data supports both. In Mumbai, 1,499 homes above ₹5 crore were registered in the June quarter for a total of ₹14,903 crore, or about 16 a day, drawn from Maharashtra stamp duty records rather than developer disclosures. The average ticket was ₹9.9 crore, and the volume came from the ₹5-10 crore band rather than from a few very large deals.
What the data does not settle#
Composition effects in price indices are the obvious one. If the mix of transactions moves up-market, an index built on transacted prices can rise without any individual property becoming more expensive. The RBI's index is based on registration authority data across 18 cities and does not fully adjust for this, so the true price path for a constant-quality home is uncertain. Repeat-sales or hedonic methods would answer the question. India does not publish one at national scale.
Causation is also unresolved. Developers say they are following demand. It is equally consistent with the data that developers moved up-market for margin reasons and buyers below the threshold simply left the market. CareEdge's own explanation cites land, construction and compliance costs pressing on affordable-project viability, which is a supply-side story. Both effects are probably present, and the available data cannot separate them.
Then there is the geographic split. Housing sales in the June quarter fell 11% in both Pune and Delhi-NCR and 7% in the Mumbai region, while Chennai rose 9%, Bengaluru and Kolkata 5% each and Hyderabad 1%. The weakest markets are the most expensive ones. That is what an affordability ceiling looks like, and it sits awkwardly with the claim that premiumisation reflects demand rather than exhaustion.
Smaller developers face a harder version of all of this. CareEdge's deleveraging figures cover the top 13 firms. Mid-sized builders with weaker balance sheets and single-city exposure do not have the option of waiting out a slow quarter, and the listed share of industry sales value rising to 23% in FY26 from 15% in FY21 is partly a measure of who is being squeezed out.
How this cycle differs from the last one#
India's previous residential downturn, running roughly from 2013 to 2019, was a volume and credit crisis. Inventory piled up, buyers stopped paying, and the collapse of IL&FS in 2018 cut off the non-bank lending that had funded much of the sector. RERA and the insolvency code changed the rules afterwards, and consolidation towards listed developers followed.
What is happening now is not that. Volume is flat rather than falling, leverage is at a multi-year low, and the RBI has held the repo rate at 5.25% through four consecutive meetings with a neutral stance. The pressure point has moved from developer solvency to household affordability.
That makes this a structural change rather than a cyclical one. The affordable segment has not paused. On CareEdge's numbers it has been designed out of new supply over four years, and no data in this week's releases suggests a mechanism that would reverse it. A cyclical downturn ends when rates fall. A supply-side reallocation driven by land and compliance costs does not.
Five things to take away#
The Indian housing market is growing through price and product mix, not through volume. Area sold has been close to flat for two years while sales value compounds at 7-9%.
Two rating agencies using different variables and different price thresholds reached the same conclusion within 48 hours. That corroboration is what makes this week's data worth attention.
Listed developer pre-sales have become a launch-calendar metric rather than a demand metric. DLF's 94% year-on-year decline reflects zero launches, not zero demand.
Developer credit risk has fallen sharply. Debt-to-collections for the largest 13 developers is at 0.68 times against 1.80 times in FY20, which makes a repeat of the 2018 liquidity crisis less likely.
The weakest sales performance is in the most expensive markets. Delhi-NCR, Pune and Mumbai all declined while Chennai, Bengaluru and Kolkata grew, which is consistent with an affordability ceiling rather than a demand boom.
Frequently asked questions#
Are Indian house prices rising quickly? Not by recent standards. The RBI's All-India House Price Index rose 3.6% in the year to June 2026, slower than the previous quarter's 4.5% and below the central bank's 6.7% GDP growth forecast for FY27. Reported sales value is growing much faster than that, which is a mix effect rather than pure price inflation.
What does premiumisation actually mean? It describes a shift in the composition of what is built and sold towards more expensive homes. It does not require any individual property to appreciate. If developers stop launching ₹60 lakh flats and launch ₹2 crore flats instead, average realisations rise even with prices per square foot unchanged.
Why did listed developers report a 21% fall in pre-sales? Mostly launch timing. Pre-sales are booked when a project opens for sale, so a quarter without launches shows near-zero bookings regardless of underlying demand. DLF launched nothing in the June quarter and reported ₹657 crore against ₹11,425 crore a year earlier. Nineteen of the 28 firms in the sample grew.
Is affordable housing disappearing? Its share of new supply has fallen sharply. CareEdge found homes under ₹1.5 crore fell from 85% of launches in early 2022 to 47% in early 2026. ICRA, using a ₹75 lakh threshold, found affordable homes at 20% of sales in FY26 against 23% in FY25. Both measure share, not absolute volume.
Does this make Indian real estate stocks attractive? That depends on assumptions this article does not make. The relevant facts are that developer leverage is at a multi-year low, quarterly pre-sales have become volatile for reasons unrelated to demand, and growth is concentrated in a narrow buyer segment. Nothing here is a recommendation, and anyone acting on it should take advice suited to their circumstances.
How reliable is the RBI house price index? It is built from registration authority transaction data across 18 cities with 2022-23 as the base year, which makes it more grounded than asking-price surveys. Its main limitation is that it does not fully control for changes in the quality and size of the properties transacting, so a shift towards larger homes can lift the index on its own.
What would reverse the trend? A meaningful reduction in land and approval costs for lower-priced projects, a policy intervention on the supply side, or a fall in mortgage rates deep enough to bring the median household back into the market. None of these appear in this week's data.
Glossary#
Pre-sales (sales bookings) are the value of homes contracted with buyers when a project opens for sale, before construction finishes. Developers recognise this as revenue only on project completion, so pre-sales lead reported earnings by years.
House Price Index (HPI) is a statistical series tracking property price changes over time, indexed to a base period. The RBI's version uses 2022-23 as its base and covers 18 cities.
Years-to-sell ratio divides unsold inventory by the recent annual sales rate, giving the number of years it would take to clear current stock at current velocity. Lower means tighter supply.
Debt-to-collections ratio compares a developer's outstanding borrowings to cash actually received from homebuyers in a period. Under 1.0 means annual collections exceed total debt.
Composition effect is the change in an average that comes from a change in the mix of items being averaged rather than from any item changing value. It is the main reason transacted-price indices can mislead.
REIT (Real Estate Investment Trust) is a listed trust that owns income-producing property and passes most of its rental income to unitholders. India's six listed REITs hold offices and malls rather than homes.
Basis point is one hundredth of a percentage point. A move from 5.25% to 5.00% is 25 basis points.
RERA is the Real Estate (Regulation and Development) Act, 2016, which requires project registration, escrow of buyer funds and disclosure of timelines. It is widely credited with accelerating consolidation towards larger developers.
References#
Reserve Bank of India, All-India House Price Index, Q1 2026-27, released 24 August 2026, as reported by ANI. Primary series available from the RBI Database on the Indian Economy.
ICRA, residential real estate outlook for FY27, 26 August 2026, reported by Business Standard.
CareEdge Ratings, residential launch mix and developer leverage analysis, 26 August 2026, reported by Business Standard.
Press Trust of India, Q1 FY27 sales bookings of 28 listed real estate companies, 23 August 2026, via Business Standard. Compiled from company investor presentations.
Lighthouse Luxury and Zapkey, Mumbai luxury registration data from Maharashtra stamp duty and registration records, Q1 FY27, reported 21 August 2026.
Reserve Bank of India Monetary Policy Committee statement, 5 August 2026, repo rate held at 5.25%, reported by Business Standard. Primary text on the RBI website.
CareEdge Ratings, Indian real estate capital inflows H1 2026, 19 August 2026.
Listed REIT distributions for Q1 FY27, 17 August 2026.
Cushman & Wakefield, coworking seat leasing across eight cities, January to June 2026, reported 27 August 2026.
This article is for information only. It is not investment advice, and nothing in it is a recommendation to buy or sell any security or property. Forecasts attributed to ICRA and CareEdge are the estimates of those agencies, not statements of fact.